Research Article - (2021) Volume 10, Issue 1
A NOVEL DETERMINISTIC EPIDEMIC MODEL CONSIDERING MASS VACCINATION AND LOCKDOWN AGAINST COVID-19 SPREAD IN ISRAEL: NUMERICAL STUDY
Motoaki Utamura1*, Makoto Koizumi2 and Seiichi Kirikami32Hitachi Research Laboratory, Hitachi Ltd., Chiba, Japan
3Hitachi Works, Hitachi Ltd., Hitachi, Japan
Received: Sep 02, 2021
Abstract
Why public health intervention by Israel government against COVID-19 spread has been successful while the most countries in the world is still coping with it? To give the quantitative answer, a simple numerical epidemic model is prepared to simulate an entire trend of various infection related variables considering vaccination campaign and simultaneous lockdown. The model is an extension of the deterministic physical model ATLM previously published by the authors that aims to predict an entire trend of variables in a single epidemic. The time series data of both vaccine dose ratio and lockdown period are employed in the model. Predictions have been compared with observed data in terms of daily new cases, isolated people, infectious at large and effective reproductive number and the model is verified. Moreover, parameter survey calculations for several scenarios have clarified a synergy effect of vaccination and lockdown have existed. In particular, it is suggested vaccination dose rate should be fast enough to achieve at least 40% effectiveness on the rescission of lockdown in order to avoid the rebound of the epidemic.
Keywords
COVID-19, Vaccination, ATLM, Epidemic model
Abbrevations
ABM: Agent Based Model; ATLM: Apparent Time Lag Model (present epidemic model); DDE: Delay Differential Equation; NPI: Non-Pharmaceutical Intervention; PCR: Polymerase Chain Reaction; SEIR: Susceptible, Exposed, Infectious and Removed model; SIR: Susceptible, Infectious and Removed Model.
Introduction
The entire world is still in a crisis of COVID-19 pandemic. The introduction of a lockdown cannot completely prevent the development of an epidemic. Mass vaccination of the population is the most radical method of limiting the growth of the epidemic. Israel government authority has started vaccination operation against Severe Acute Respiratory Syndrome Coronavirus 2 (SARS-CoV-2) on December 19th 2020 earlier than most other countries. Cumulative doses exceeded 100% toward the end of March 2021, which was fastest in the world. In parallel the lockdown was practiced. As a result, daily new cases drastically decreased from a peak of 10 thousand to 5 hundred at the end of March 2021. This successful experience should be shared in other countries. To do so it is essential to have a prediction model to count the number of people infected given the data of vaccination dose rate and the period of lockdown. SIR model has been widely used mainly in developing countries in need of coping with various infectious diseases where collective population is small [1]. However, for COVID-19 situation has been changed. Spread of infection is prevailing in developed countries with large collective population, where SIR and its derivatives could not solve the whole governing equation straightforward but under the assumption that susceptible (S) is replaced by collective population. Then, its application has been limited to the initial stage of the epidemic.
On the contrary, full simulation of the entire epidemic is needed to take efficacy of vaccine into consideration. Few SIR models with vaccination effect have been reported so far [2]. Alternatively Agent Based Model (ABM) has been recently investigated. The ABM is a kind of stochastic approach and differs from mathematical models such as SIR and SEIR in that it can set up a virtual society consisting of a large number of autonomous decision-making and action actors (Agent) with various attributes and can analyze complex social events involving interactions between actors [3-7]. Based on the rules we set on a computer, agents act spontaneously while interacting in a given environment. There are reports that simulated the comparative and joint impact of COVID-19 vaccine efficacy and coverage together with non-pharmaceutical interventions (NPI) by taking population of US cities as an example [6,7]. They suggested non-pharmaceutical interventions such as masking, social distancing etc. are still requisite to reduce infections against SARSCoV- 2 even if higher vaccine coverage and efficacy are attained. In this method, detailed setting is possible, but it needs many empirical constants because of its stochastic approach and the calculation may take time depending on the scale. Moreover, comparison was made only in terms of cumulative basis. Prediction needs to be examined with factors such as inpatients, daily new cases etc. by available observations. In view of these difficulties in the past literature, a novel deterministic approach based on discrete delay differential equation was attempted in the present study. Apparent Time Lag Model (ATLM) was extended to include observed vaccine dose rate and NPI in Israel and the validity of the present model was demonstrated using publicly available data. This model is featured in small number of measurable constants [8].
Methodology
Data
Infectious data of COVID-19 in Israel was referred to Worldometersand statistics of vaccination and reproductive number of COVID-19 were cited by Our World in Data [9,10]. Israel’s vaccination started on December 19 2020 and total dose rate per habitant exceeded 100% toward the end of March 2021. Lockdown was issued from December 27 2020 till February 5 2021 [11,12]. Data for time lags H (delay in PCR reporting date from infection), V (period of isolation), and T (period from infection till isolation) were set 14 days, 12 days and 14 days respectively [13,14].
We adopted SARS-CoV-2 infection data in Israel from November 8 till March 31 for analysis when most influential variant was ï¼®501ï¼¹ï¼?αï¼?in Israel. Various data such as daily new cases, cumulative infections, currently isolated, currently infected and reproductive number were used to examine the numerical model. We assumed all the vaccine dosed is Pfizer-BioNTech vaccine (BNT162b2 mRNA COVID-19 vaccine). Its effectiveness in real world was assumed 80% for single dose recipient at ten days or later after injection and similarly 95% for double dose recipient in consideration of reports [15-20].
ATLM with vaccine model
Coronavirus SARS-CoV-2 causing COVID-19 pandemic includes several time delays events in the spread of infection as follows:
(1) Lose infectious capability and extinguish within a month if no second infection occurs.
(2) Incubation time is about 5 to 7 days after infected in which last 2 or 3 days are infectious period.
(3) Infected individuals are detected and recognized as PCR positives in delay of about two weeks.
(4) PCR positives are mandatorily isolated and released after certain time according to administrative guidance.
(5) Effectiveness of mass vaccination is revealed in about ten days.
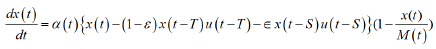
Therefore, the mathematics of SARS-CoV-2 epidemic can be understood as demography of progressive events with time delay. Taking primary dependent variable as cumulative infections x (t), Apparent Time Lag Model (ATLM) formulates infection spread using a single discrete delay differential equation (DDE) in a natural manner [8]. It is different from conventional deterministic approach such as SIR model where delay is implicitly included in transmission rate that’s reciprocal implies 1st order delay. ATLM provides a full simulation of a whole wave of the epidemic while SIR model expresses an entire solution as a combination of plural piecewise solutions in a small period. To do so ATLM introduces virtual collective population (M) instead of actual one (N) of the area in concern. M is not known a priori and to be determined by parameter fitting. M is much smaller than N, which matches the observation that action range of ordinary person is limited and thus consecutive infections may likely happen in the same area. As we can regard M as susceptible at time t=0, we assume that mass vaccinations play the role to reduce M. In the subsequent analysis we placed following assumption for simplicity: Every infected person onsets, being PCR positive and eventually quarantined (isolated) T days after infection. Then infectious at large at time t can be counted as x(t)-x(t-T) without asymptomatic patients since infected individuals before t-T are all quarantined. With asymptomatic patients considered, the infectious at large would be expressed by x(t)-(1-ε)x(t-T)- εx(t-S) (see ref. [8]). The portion of susceptible may be expressed by 1-x (t)/M (t). We assume the rate of new infection dx (t)/dt is proportional to the product of infectious at large and the portion of susceptible. Hence, governing equation of ATLM becomes
 (1)
(1)
 (2)
(2)
Where, x(t): cumulative infected individuals, dx(t)/dt: rate of new infection, α0: transmission rate(1/day), M0: virtual collective population, S: period from infection till removed,ε: asymptomatic portion of infected individuals, μ(t): effectiveness of vaccination (%), ρ(t): dis-mobility of people, u(t): step function. As the influence of vaccination corresponds to the reduction of susceptible, we expressed net collective population of a group M(t) with effectiveness of vaccination. Also, the effect of lockdown is the decrease in people’s mobility and reduction of transmission rate. Given initial value x(0), Equations 1 and 2 were solved numerically using 4th order Runge Kutta Gill method with a time step of half day and obtained x(t).
Then the rest of infection related variables were calculated by use of the solution x(t) of Equations 1 and 2 as follows:
Cumulative positive number Y(t) is reported in delay of H days then
Y(t )= x (t -H) (3)
Where H: period from infection till PCR test result report reaches public health authority. H was assumed to be 14 days [13].
Similarly, daily new cases reported by public health authority, are actually daily new positive cases dY(t)/dt expressed by
 (4)
(4)
As cumulative quarantined patients are expressed by (1-ε)x(t-T), then infectious at large W(t) is the sum of new infection in the period [t-T, t] namely
 (5)
(5)
Where T is a period during which infected keep infectious at large (or until isolated) and adopted the value of 14 days. It is because T=L+F+G, where L: incubation period of 5 days, F: period of getting tired 5~7 days, G: go to hospital and quarantined 2~3 days, which yields 12(=5+5+2)
The number of isolated people P(t) consisting of hospitalizations, self-isolated at hotels and home and people under adjusting can be counted by the difference between isolated and discharged.
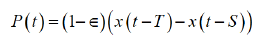 (6)
(6)
Where (1-ε) x (t-S) is the number of recovered or deaths. Denoting isolation period as V, S can be written as the sum of T and V i.e., S=T+V. Israel’s Health Ministry decided to shortened the mandatory coronavirus isolation period from 14 days to 12 days, provided the patient received two negative tests from November 12 2020[14]. Then, V=12 in Israel. Therefore, S=T+V=14+12=26.
The effective reproductive number is defined as the average number of secondary cases by a primary case. ATLM defines the effective reproductive number Rt(t) in which the basic reproductive number is α(t)T [8] as
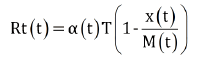 (7)
(7)
In subsequent sections, we will compare predictions by Equations 3-7 with available data from Worldometer and Our World in Data and examine the present analysis method [9,10]. As the value of εwas unknown in Israel, we assumed ε =0 in the calculation.
In summary, the values of delay parameters adopted in the prediction are H=T=14, V=12, S=26 which will be used throughout this paper.
Modeling of vaccination in Israel
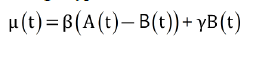
Let the number of people vaccinated per 100 habitants A, those vaccinated twice, B and cumulative doses per 100 habitants C, then those vaccinated only once becomes A-B and A+B=C holds at any instance. When vaccination was completed i.e., everyone is two times recipient, then C would be 200%.
Trends of data for A, B and C in Israel are shown in Figure 1 [10]. The target value of B is said to be 5.5 million among 9 million citizens which has been almost accomplished before the end of March. Let efficacy of vaccine for a single dose recipient βand that of double dose one γ, then average efficacy μ (t) of a group consisting of both A and B is written for a single type vaccine.

Figure 1: The number of people of A, B per 100 habitants and total vaccine dose per 100 habitants C in Israel. Abscissa represents time (days) and its origin is October 25 2020 where calculation starts. A, B and C are observed data in which A and B represent the number of people vaccinated per 100 habitants and those vaccinated twice in Israel. C is total doses per 100 habitants. Axis shows the number of people or doses per 100 habitants. Vaccination started on December 19 (55days) onward. Total doses exceeded 110 at the end of March 2021(157days), Note: people fully vaccinated per hundred, B;
 people vaccinated per hundred, A
 (8)
(8)
Virus type of 3rd wave epidemic in Israel is mainly Britain type variant [15]. Efficacy of BNT162b2 mRNA COVID-19 vaccine (Pfizer-BioNTech COVID-19 vaccine) in a nation-wide mass vaccination campaign in Israel is reported in peer reviewed articles [18-20]. Referring to these we adopted β=0.8 and γ=0.95 and assumed vaccine activated after ten days of vaccination for both single and double injection recipients.
Data plot of μ(t) Equation 8 and its polynomial approximation Equation 9 is presented in Figure 2.

Figure 2: Presumed effectiveness of mass vaccination (in case of no delay). Inferred from observed data by Equation (8) for collective population composed of recipients mixed up with single and double dose vaccinated. Axis represents expected number of people per 100 habitants and abscissa time (days). Vaccination began on December 19(55days), 2020
 (9)
(9)
Since the effectiveness of vaccine becomes activated inξdays after injection, μ(t) in Equation 9 was replaced by μ(t-ξ). Referring to literatures we assumed ξ=10 in the computation [16,17].
Modeling of lockdown
Israel government executed a national lockdown as a necessary step to block the increase of morbidity on December 27, 2020(63 days) for two weeks with an option to extend it. Actually, it was extended until February 5, 2021(103 days) because it saw delay in turnaround from the health and economic crisis on January 31, 2021(98 days) [10,12]. We modeled lockdown effect by a sudden decrease in transmission rate as shown in Figure 3. Its duration was from 63 days through 103 days.

Figure 3: Modeling of lockdown. Axis represents 1-ρ(t) in Equation (2). Lockdown was operated during 63days and 103days. Its effect is anticipated to become apparent on 77days and 117days because of delay in reporting
(1-ρ (t))min was set to 0.72 as a result of parameter fitting. Other parameter values determined after fitting were x (0) =650, α0=0.117 and M0=1,500,000 respectively. They were used throughout subsequent calculations.
Results
Daily new cases and total cases
Daily new cases were taken from Worldometer data source first for comparison with prediction by ATLM equipped with vaccine and lockdown models [9]. Investigated period of time was from November 8, 2020 through March 31, 2021 which covers a whole span of the third wave of COVID-19 epidemic in Israel in which mass vaccination and a nation-wide lockdown were involved. We regarded the term ‘daily new cases’ in Worldometer as daily new positives that are observed behind new infection by H days (14 days). Computation started ahead of November 8, 2020 by H days i.e., October 25, 2020 that are the origin of time.
Figure 4 compares prediction with observed data. Both are expressed as 7-day average basis to avoid fluctuation caused by the difference in the number of PCR tests in a week. The prediction is 7-day average of dY/dt Equation 4. There are important findings in the following:

Figure 4: Daily new cases by observation and prediction. Red line: data, blue: prediction, yellow: effectiveness of vaccination 1-μ (t)/100 referring to right axis. Left axis: the number of new infected, Abscissa: time(days) origin of time coincides with October 25, 2020, 14 days ahead of November 8, the start of 3rd wave of epidemic investigated in this study. Both data are displayed as 7-day average. The 3rd wave of COVID-19 epidemic in Israel was regarded from November 8, 2020 to March 31, 2021. Nation-wide mass vaccination started on December19, 2020(55days). Its effectiveness was revealed behind ten days(65days). Lockdown was operated between December 27, 2020(63days) and February 5, 2021(103days). Calculation shows dY(t)/dt which was carried out using Equation (4). Note:  approx. equation (11)
- Impacts of the start and the release of lockdown are seen apparent at 77 days and 117 days in data respectively while the actual dates when the public health interventions were 63 days and 103 days respectively. The former reduces rate of infection resulting in the appearance of a peak, the latter producing plateau as a result of antagonist between rebound of the lockdown and the efficacy of vaccine. This fact implies the assumption H=14(infection becomes apparent in delay of 14 days) are proper. Both observations in data were simulated by the prediction within 10% precision in the aspect of both time and magnitude.
- In the early stage of the epidemic the prediction is seen to underestimate the observed data. This fact can be interpreted as follows. The observed data contain tailing effect of the 2nd wave if we note November 8(14 days) is when the minimum daily cases appear between 2nd and 3rd waves. The plateau appearing around 90 to 100 days were not reproduced in computation. This might be caused by an initial additional lockdown intervened on January 8, 2021 as disclosed in the recent literature [22]. As a whole, however, the simulation of the entire trend of daily new cases was satisfactory.
Figure 5 presents cumulative positives Y (t) Equation 3. Excellent agreement was attained between prediction and observed data. Underestimation in the early phase and toward the end comes from the same reason mentioned above.

Figure 5: Trends of cumulative positives. Equation (3) was used to calculate cumulative positives, Y(t), Observed;
The number of isolated patients
The trend of the number of isolated patients is presented in Figure 6. Although calculation by Equation 6 overestimates actual data by 15% at a peak around 85 days, overall trend is well simulated. In particular, the trend after 130 days was accurately simulated. This also proves the assumption T=14 in the model is correct because larger value of T would result in overestimation and vice versa for smaller one.

Figure 6: Trend of currently isolated patients. Orange dots are data cited from worldometer whose notation is ‘currently infected’ [9]. Blue line is prediction by ATLM. Coincidence in timing implies the assumption T=14 are proper. Time to give peak is behind that of daily new cases (Figure 4) by a week. Note: 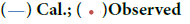
Reproductive number
Figure 7 compares Equation 7 with data with respect to reproductive number (Rt(t)) [10]. The Rt(t) data in Our World in Data have been compiled by the method described in the literature [23]. It contains real- time estimates of the effective reproductive number. Their estimates of Rt(t) for COVID-19 for 124 countries across the world are provided and used to assess the effectiveness of non-pharmaceutical interventions in a sample of 14 European countries. Thus the data could be most reliable at this moment.

Figure 7: Effective reproductive numbers. Observed data was cited from our world in data and Equation (7) was used for calculation [10]. Note: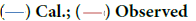
Apart from an early phase, prediction for 3rd wave of epidemic in Israel coincides well with estimates from observed data especially in the period vaccination and lockdown were carried out. Discrepancy in the early phase could be accounted for by the existence of the tail of 2nd wave of epidemic aforementioned.
The basic reproductive number α0T for Israel was estimated by the ATLM as 0.117 × 14=1.64 which is much smaller than those evaluated by for USA and eight European countries [24].
The number of infectious at large
It is important to recognize infectious at large is an important infection variable to tell when epidemic will end, much more accurate than daily new cases. It is because the time to give W (t)=0 rigorously indicates the end of epidemic. Next, we will show the infectious at large may be obtained through data processing as follows. Substitution of daily new cases Y (t) to RHS of Equation 5 would yield W (t-T). W (t) would be obtained by shifting the profile of W (t-T) leftward by T along time axis. To confirm the validity of obtained W (t) in this way, agreement was confirmed with numerical prediction whose precision has already been examined through arguments described in the previous section. As shown in Figure 8, excellent agreement is seen between two, which suggests the correctness of the data processing mentioned above. W (t) peak to dY(t)/dt ratio was evaluated to be about 13 times.

Figure 8: Infectious at large. Red line is processed from data and blue line from prediction, Note: 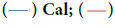 Observed
Based on the confirmed epidemic model, parameter survey calculations were conducted for following four scenarios.
(1) Without vaccination, without lockdown: case C μ=ρ=0
(2) With vaccination, without lockdown: case D μ≠0, ρ=0
(3) Without vaccination, with lockdown: case B μ=0, ρ≠0
(4) With vaccination, with lockdown: case A (real intervention) μ≠0, ρ≠0
Results are presented in Figure 9.

Figure 9: Predicted daily new cases for various combinations of public health interventions with or without vaccination and lockdown. Axis: daily new cases, Abscissa: time (days) Case A: With vaccination, with lockdown, Case B: Without vaccination, with lockdown, Case C: Without vaccination, without lockdown, Case D: With vaccination, without Lockdown. Note: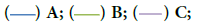

Without lockdown, peaking value would grow 2~2.5 times larger than real one C/B. Without vaccination, the epidemic would decelerate in a later stage C/D and even worse on earlier release of lockdown. Without lockdown, blue line (A) would have shifted to red (D). If vaccination dose rate had been slower, blue (A) would have approached grey (B). In general, lockdown has impact to decrease the rate of transmission, while vaccination accelerates to converge epidemic. Next, separate effect of either vaccination or lockdown was investigated by taking ratios D/C and B/C.
Figure 10 presents the joint impact of both ratios.

Figure 10: Separate effect of vaccination and lockdown on reduction of infection. Ratio B/C (blue line) denotes lockdown effect without vaccination. Ratio D/C (red line) represents vaccination effect without lockdown. Ratio A/C (green line) shows real combined effect. Note: 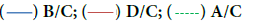
Here, the ratio means relative infection rate to C. The smaller the ratio the lower will be the infection rate. As vaccinations proceed, the ratio D/C monotonously decreases. To the contrary, the ratio B/C of lockdown has a minimum due to rebound on the release of lockdown. It is seen until 120 days the impact of lockdown exceeds that of vaccination. After 120 days the effect of vaccination is superior to lockdown. Combined effect A/C is presented in a broken line, which shows the suppression of rebound to some extent owing to vaccination. There exists a period (90 days~125 days) of synergy when the green broken line has the smallest ratio among three. It is inferred the faster the dose rate, the smaller the magnitude of the rebound, which would contribute to earlier ending of the epidemic.
Discussion
ATLM equipped with newly developed vaccination and lockdown model simulated a whole trend of various infection variables for COVID-19 3rd wave epidemic in Israel within 15% error. In particular, the number of isolated PCR positives and infectious at large were separately evaluated with high resolution. Moreover, the equation of effective reproductive number Equation 7 derived from ATLM showed a good agreement with real time estimates in Israel by the method which provides estimates of R for COVID-19 for 124 countries across the world, and they are used to assess the effectiveness of non-pharmaceutical interventions in a sample of 14 European countries [10,23].
These facts affirm the present vaccination model whose concept is to reduce virtual collective population by acquired effectiveness of the vaccination.To the contrary, most previous works mainly using ABM disclosed so far were limited to total and daily new cases and showed no prediction of the trend of the effective reproductive number [4-6].
Separate effect of vaccination and lockdown was explored. Although lockdown is most effective to suppress infection rate in ascending phase of epidemic, it is inevitable to induce rebound on its release. Vaccination is found to be a strong tool to suppress it. To make this effective, it was inferred from parameter survey calculations that vaccination dose rate should be fast enough to achieve at least 40% effectiveness on the rescission of lockdown.
Additionally, data processing method to extract infectious at large from total cases was clarified. The infectious at large W(t) is a decisive index to estimate the end of the epidemic when W (t) becomes zero which occurs behind the time when daily new cases become zero. It yields a conservative measure to plan public health prevention and control of epidemic.
In the present study ATLM ignored asymptomatic patient, i.e. ε=0. Nonetheless prediction succeeded in explaining the profile of various observed data trend within tolerable range of errors, especially for the number of isolated individuals and infectious at large. This fact implies most of asymptomatic patients, if any, might have been noninfectious in Israel.
Limitations of the present method follow. First, the present vaccination model is established based on efficacy data of BNT162b2 mRNA COVID-19 vaccine (Pfizer- BioNTech COVID-19 vaccine). It could be easily extended to accommodate other COVID-19 vaccines. Also, it is assumed activation time needed after injection ξ=10. Since other observations exist, wide parameter survey is requisite to get a conservative solution for policy making.
In summary, this study is the first work of a full simulation of the 3rd wave of epidemic in Israel accompanied by mass vaccination campaign and simultaneous lockdown. Existing data and policy making elsewhere would be aided by inclusion of the present model On its occasion potential users of the present model are advised to reassess the values of the delay constants T, H,V, ξ in the model when the application to other countries is attempted because they are influenced by the difference in medical regulations or practice.
Conclusion
A simple numerical epidemic model is proposed to simulate an entire trend of various infection related variables considering vaccination campaign and simultaneous lockdown. The model is an extension of the deterministic physical model ATLM previously published by the authors which is described by a single discrete delay differential equation with explicit inclusion of time lag of isolation of infectious. It gives full simulation of various infection variables in the entire span from the initial infection through endpoint with a small number of fitting parameters. The time series data of both vaccine dose ratio and lockdown period were employed in the model. The model was examined within 15% of errors compared with Israel’s COVID-19 various epidemic trend data such as daily new cases, the number of isolated people and infectious at large, and effective reproductive number. Moreover, parameter survey calculations for several scenarios have clarified there exists a synergy effect between vaccination and lockdown. In particular, it is suggested vaccination dose rate should be fast enough to achieve at least 40% effectiveness on the rescission of lockdown in order to avoid the rebound of the epidemic.
Data Availability
We used time-series data of COVID-19 for November 8,2020 through March 31,2021 in Israel.
Author Contributions
M. Utamura developed and verified the epidemiological model. S. Kirikami developed vaccination model. M.Koizumi examined calculation results by another solution algorithm. All authors have read and agreed to the published version of manuscript.
Funding
This research did not receive any specific grant from funding agencies in the public, commercial or not-for-profit sectors.
Conflict of Interest
The authors declare that they have no conflict of interest related to this report or the study it describes.
Acknowledgements
Authors are indebted to Prof. Shin-ichi Inage of Fukuoka University for his assistance in selecting journal for submission. They are also grateful to the editor for kind guidance.
References
- Kermack WO, Mckendrick AG. A contribution to the mathematical theory of epidemics. Proc. The Royal Society A. 1927;115(772):700-721.
- Below D, Mairanowsky F. The impact of vaccination on the spread patterns of the COVID epidemic. medRxiv. 2021.
- Patel MD. The Joint impact of covid-19 vaccination and non-pharmaceutical interventions on infections, hospitalizations, and mortality: an agent-based simulation. medRxiv. 2020.
- Cuevas E. An agent-based model to evaluate the COVID-19 transmission risks in facilities, Comput Biol Med. 2020 Jun;121:103-827.
- Chang E, Moselle KA. Agent-based simulation of covid-19 vaccination policies in COVID SIMVL. medRxiv. 2021.
- Alagoz O.The impact of vaccination to control COVID-19 burden in the United States: A simulation modeling approach. medRxiv. 2021.
- Truszkowska A, et al. High‐resolution agent‐based modeling of COVID‐19 spreading in a small town - truszkowska - 2021 - advanced theory and simulations - Wiley Online Library. 2021.
- Utamura M, Koizumi M, Kirikami S. An epidemiological model considering isolation to predict COVID-19 trends in Tokyo, Japan: numerical analysis. JMIR Public Health Surveill. 2020 Dec 16;6(4):e23624.
- Israel COVID: 836,926 Cases and 6,334 Deaths -Worldometer
- Coronavirus (COVID-19). Vaccinations - statistics and research - Our World in Data
- Israel government press release. Joint Prime Minister's Office-Health Ministry Statement. Prime Minister's Office.
- Egypt independent. Israel extends lockdown, sees delay in COVID-19 turnaround. Egypt Independent. 2021.
- Maki K. A delayed SEIQR epidemic model of COVID-19 in Tokyo area. medRxiv, 2020.
- The Jerusalem post, COVID-19 isolation period to be shortened to 12 days starting Thursday - The Jerusalem Post. 2020.
- CDC Newsroom. CDC real-world study confirms protective benefits of mRNA COVID-19 vaccines. CDC Online Newsroom. 2021.
- Tande AJ. Impact of the COVID-19 vaccine on asymptomatic infection among patients undergoing pre-procedural COVID-19 molecular screening. Clin Infec Dis Oxf Aca. 2021.
- Pfizer Inc. Real-World evidence confirms high effectiveness of Pfizer-BioNTech COVID-19 vaccine and profound public health impact of vaccination one year after pandemic Declared.
- Amit S. Early rate reductions of SARS-CoV-2 infection and COVID-19 in BNT162b2 vaccine recipients -The Lancet. 2021.
- Dagan N. BNT162b2 mRNA COVID-19 vaccine in a nationwide mass vaccination setting (NEJM). N Engl J Med. 2021; 384:1412-1423.
- Polack FP. Safety and efficacy of the BNT162b2 mRNA COVID-19 vaccine NEJM. N Engl J Med. 2020; 383:2603-2615.
- Lauer SA. The incubation period of coronavirus disease 2019(COVID-19) from publicly reported confirmed cases: estimation and application.Ann Intern Med. 2020;172(9):577-582.
- Haas EJ. Impact and effectiveness of mRNA BNT162b2 vaccine against SARS-CoV-2 infections and COVID-19 cases, hospitalizations, and deaths following a nationwide vaccination campaign in Israel: an observational study using national surveillance data. Lancet. 2021; 397: 1819-29.
- F A Marioli . Tracking R of COVID-19: A new real-time estimation using the kalman Filter. 2020.
- Ke R. Estimating the reproductive number of SARS-CoV-2 in the United States and eight European countries and implication for vaccination. Theoretical Biology. 2021;517:110-621.

Google Scholar citation report
Citations : 147
Journal of Harmonized Research in Pharmacy received 147 citations as per google scholar report